Rails debugging has gotten really good lately; a new Rails project automatically includes the ruby debug gem, and it is enabled by default in development. The Rails instructions for it work great if you start your server with rails server and want to use the command line debugging interface. However, I prefer to run all my apps with puma-dev to give myself a nice local test domain name, and I prefer to use vscode for debugging.
Luckily, with just a little bit of code, we can configure the debug gem to automatically open a named debug socket on app launch that we can attach to via vscode and the vscode-rdbg extension.
Add the following lines to your config/environments/development.rb file:
# config/environments/development.rb
Rails.application.server do
  DEBUGGER__.open(nonstop: true, session_name: "my-app-server")
end
Rails.application.console do
  DEBUGGER__.open(nonstop: true, session_name: "my-app-console")
end
I want to call out a little known Rails feature that I’m taking advantage of here. The .console and .server code blocks are handy built in Rails methods that facilitate running code on boot specifically when in the context of a console session or server session. By using them, I can easily specify different debug session names for each context.
DEBUGGER__.open is the method to manually open a debug session. By specifying nonstop: true we are telling the debugger to not stop the process upon launch which is important so that the app can run like normal if there are no attached debug sessions or breakpoints. The session_name parameter allows a custom string to be appended to the unix socket and is used to identify the session in vscode when attaching to the debugger while multiple sessions are open.
To attach to the debugger in vscode, you will need to install the vscode-rdbg extension and add a launch configuration to your .vscode/launch.json file. Here is an example of what that might look like:
{
  "version": "0.2.0",
  "configurations": [
    {
      "type": "rdbg",
      "name": "Attach with rdbg",
      "request": "attach",
    }
  ]
}
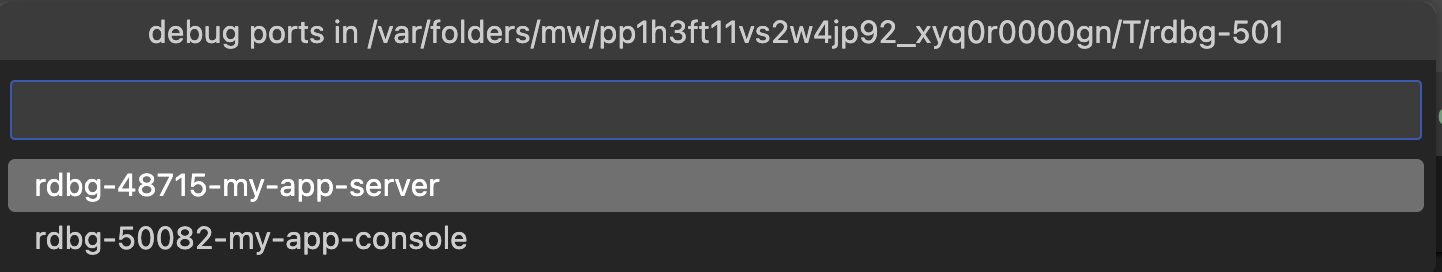
Now when you start the debug session in vscode, if there is more than one active debug session you will be prompted to select which one you want to attach to. The custom session names make it easy to find the right one. You can then set breakpoints and inspect variables as you would expect.